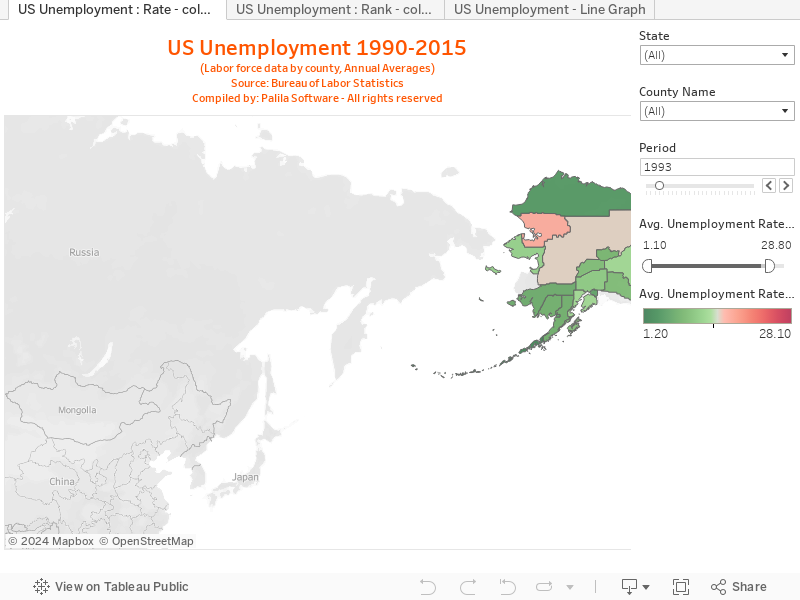
Take a look at this data visualization for unemployment patterns in the US from 1990-2015.
This visualization shows the unemployment patterns in different counties across US from 1990 to 2015. Each tab in the visualization allow you to analyze the data by applying filters available.
Take a look at this data visualization for unemployment patterns in the US from 1990-2015.
See some of the work we have done with Analytics around the election.
The NOAA - ISH hourly data from 1901 was collected and loaded into datawarehouse... Read More